Protocol Visualization
Test new protocols in the Opentrons OT-2 App before running them on your OT-2. Use protocol visualization to:
- See protocol steps, including labware and liquid changes, even while offline and disconnected from the OT-2.
- Detect and fix protocol errors before the first run.
- Assess new protocols created with Protocol Designer, OpentronsAI, or the Python Protocol API.
Click Visualize on any OT-2 protocol's details page to get started. You'll be able to see details for any protocol using API version 2.16 and newer.
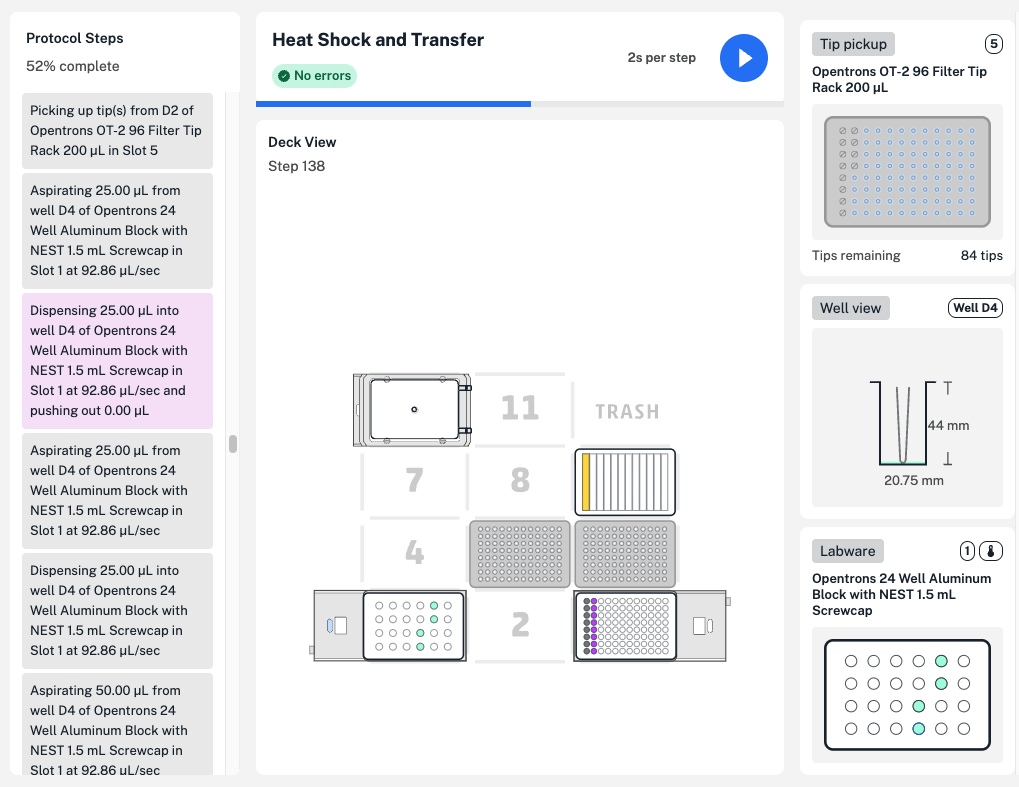
The visualization screen shown above includes protocol steps on the left, a view of the OT-2 deck in the middle, and hardware and labware details on the right. The following sections take a closer look at using protocol visualization to preview, troubleshoot, and edit your OT-2 protocols.
Protocol steps
Choose how to visualize your OT-2 protocol's steps:
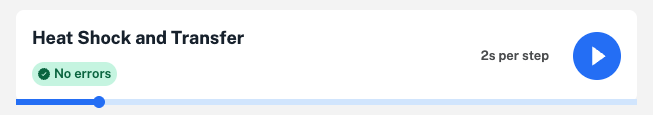
- Click the play button at the top of the page to play your protocol, and click the playback speed on the right (seconds per step) to choose another option.
- Click and drag the blue bar to move through the protocol steps.
- Scroll the timeline on the left and click on any protocol step to view it.
For each step of your protocol, the deck view changes to include liquid, labware, and pipette tip changes.
Note
In the example protocol above, liquids are assigned a color in Protocol Designer, so wells containing liquids are colored and changes on the deck are more visible.
You're not required to define or label liquids in protocols created using the Python Protocol API. To see liquid changes on the deck, we recommend using optional liquid labels and colors for the best protocol visualization.
Step details
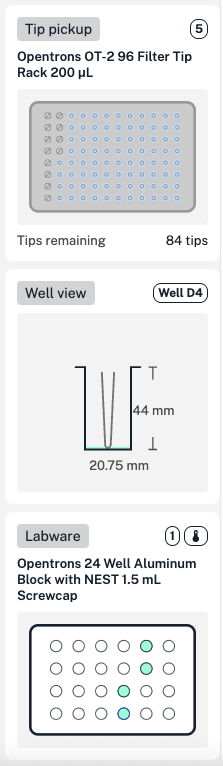
For each step, additional protocol details appear on the right side of the screen:
- Pipettes: attached pipettes and their mounts, including the active pipette performing liquid handling actions.
- Tip pickup: a closer look at where tips will be picked up for this step, including the number of remaining tips in the rack.
- Well view: well dimensions, the position of the pipette's attached tip, and a side view of liquids in the well.
- Labware: top-down view of liquid and well changes in labware like well plates and reservoirs.
Slot spotlights
At any point in your protocol, hover over labware on the deck to see labware names. For a closer look, click any slot to open a slot spotlight in a new window.
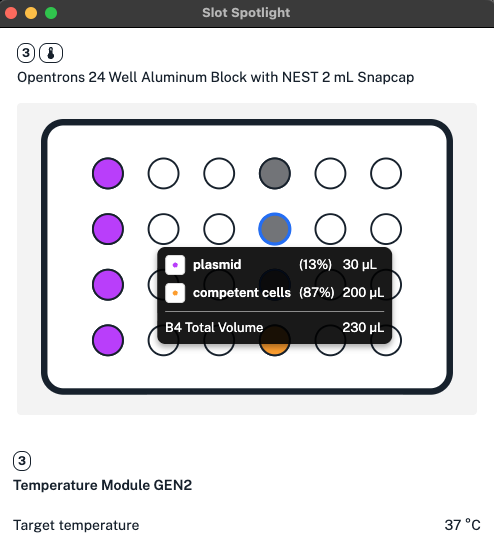
Open a slot spotlight to see changes over the course of your protocol. For example, spotlight a slot with a tip rack and drag the blue bar to see how quickly tips from that rack are used. Or spotlight a slot with a module to see changes in temperature, lid position, or other status.
Visualizing errors
When you import any protocol, the Opentrons OT-2 App analyzes it for errors. You can still visualize a protocol with errors, but you won't be able to see step details past the error.
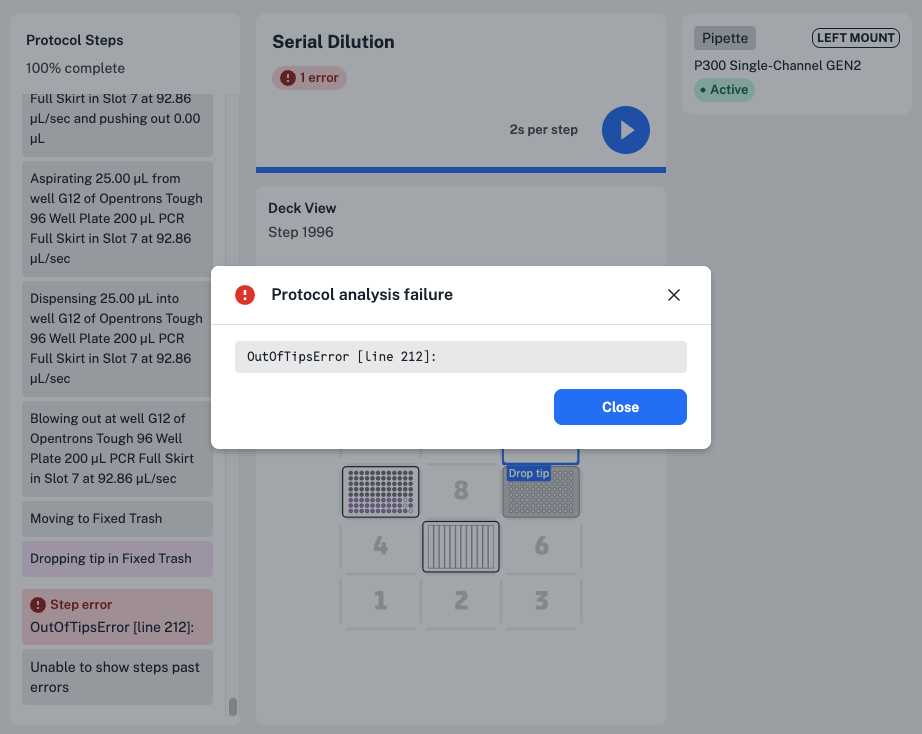
In this example serial dilution protocol, the tip rack would run out of tips before the robot can complete the final transfer step. Scroll in the timeline on the left to view the step the error occurs in, and click to view error details.